Building a business is remarkably similar to flying an aircraft. In the "Build" phase—where you develop your Minimum Viable Service—you are essentially constructing the airframe, attaching the wings, and turning over the engine. It is an act of raw creation. However, once you are actually in the air, you need more than just adrenaline and a gut feeling to stay aloft and reach your destination. You need a dashboard. You need instruments that tell you your altitude, your fuel levels, and your heading.
In the Lean Startup methodology, this dashboard is known as Measurement. Without it, you are flying blind through a storm. Most traditional small business owners only look at one solitary number: the balance in their bank account at the end of the month. While cash on hand is undeniably important, it is a "lagging indicator." It tells you what happened in the past, but it doesn't tell you if you are actually growing, if your profit margins are eroding, or if you were simply lucky this month.
To build a venture that stands the test of time, you need what is known as Innovation Accounting. This is the disciplined practice of tracking the specific, granular numbers that prove your business model is actually working and scalable. This guide will show you how to move past the guesswork and use hard data to navigate your business toward long-term success.
Moving Past Vanity Metrics
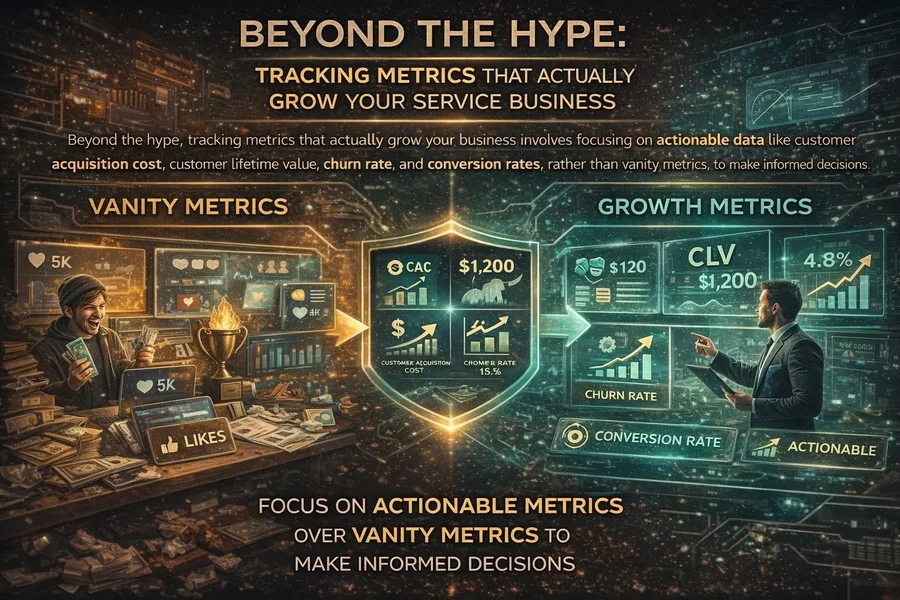
Before we can identify the numbers that matter, we must perform an audit of the numbers that don't. Many new entrepreneurs fall into the "Vanity Metric" trap. These are data points that make you feel successful and popular but have zero correlation with the actual health or profitability of your business.
Common examples of vanity metrics include:
- How many "likes" or "hearts" your latest social media post received.
- The total number of visitors to your website who didn't fill out a contact form.
- Your total number of followers on Instagram or TikTok.
While these numbers can be a boost to your ego, they are functionally useless because you cannot pay your suppliers or your mortgage with "likes." You need Actionable Metrics. These are figures that force a decision.
For instance, if your dashboard shows that twenty people requested a quote last week but only two people approved them, that is an actionable metric. It tells you immediately that there is a "leak" in your sales funnel. Is your pricing too high? Is your quote taking too long to arrive? Is the way you explain the service confusing? Because you tracked the "Close Rate" rather than just "Website Hits," you now know exactly where to focus your energy to fix the problem.
The Golden Metric: Customer Acquisition Cost (CAC)
Calculating it is simple math: take your total marketing and sales spend for a month and divide it by the number of new customers you acquired in that same period. For example, if you spent $1,000 on Google Local Services Ads, yard signs, and flyers, and those efforts resulted in 10 new clients, your CAC is $100.
Because it determines the viability of your entire business.
Why is this the "Golden Metric"? Because it determines the viability of your entire business. If your average profit on a job is $80, but it costs you $100 in marketing to get that customer, you are effectively paying $20 for the privilege of working for them. You are losing money on every sale, and "making it up in volume" will only lead to a faster bankruptcy.
By tracking CAC across different channels, you gain a superpower. You might discover that Facebook ads cost you $150 per customer, but high-quality yard signs in the right neighborhood cost you only $15 per customer. With this data, you can stop "spraying and praying" with your marketing budget and pour your resources into the channels that actually deliver a return on investment.
The Math of a Profitable Job: The Cost-Plus Formula
To ensure your business is actually healthy, you must measure the profitability of every individual job. You cannot afford to "guesstimate" your prices based on what the guy down the street is charging. Instead, you must use a rigorous Cost-Plus Pricing Formula to ensure every hour you work contributes to your bottom line.
A professional service price is built on four distinct layers:
For example, if the combined cost of your labor, materials, and overhead for a job is $200, and you want a 25% profit margin, you cannot just add 25% to the cost. You must apply a markup (in this case, 33.3%) to ensure that after all expenses are paid, 25% of the total check is pure profit. Without measuring these inputs, you aren't running a business; you're running a charity.
Choosing Your "Source of Truth": FSM Software
You cannot track these complex metrics in your head, and a coffee-stained notebook is not a scalable data strategy. In the modern era, lean service businesses use Field Service Management (FSM) software. Think of this software as the central nervous system of your company. It handles your scheduling, your quoting, your invoicing, and—most importantly—your data collection.
There are three primary leaders in this space for lean founders:
- Jobber: Widely considered the gold standard for solo operators and small teams. It is designed for speed and ease of use. It allows you to see exactly when a customer opens a quote, providing you with the data you need to follow up at the perfect moment.
- Housecall Pro: Excellent for those who want to focus heavily on the "Customer Experience." It features robust "Pipeline" tracking, showing you exactly where every lead is in the journey from "interested" to "paid in full."
- FieldPulse: A highly flexible tool that excels in more complex environments or commercial work. It provides deep customization for those who want to track very specific data points across multiple types of services.
Measuring Friction: Payments and Cash Flow
In a service business, "Friction" is any barrier that stands between you completing the work and the money hitting your bank account. Friction is the enemy of growth. If you finish a job on Monday but don't get a check until the following Friday, that is an eleven-day gap where your money is working for the customer instead of for you.
You should track your "Average Days to Pay." This is a key metric for cash flow health. To drive this number as close to zero as possible, you must adopt Frictionless Checkout. Using integrated payment processing through your FSM or tools like Square allows for "Invisible Payments." You send a link to the customer’s smartphone, and they pay via Apple Pay, Google Pay, or Credit Card while you are still standing on their property. This eliminates the "I'll mail you a check" excuse and ensures that your cash flow remains a roaring river rather than a stagnant pond.
The Review Engine: Measuring Your Reputation
Google’s algorithms act as a digital gatekeeper, and they decide who to show to potential customers based on three specific metrics:
You must track your "Review Conversion Rate." If you complete twenty jobs a month but only receive one review, your engine is stalling. Most FSM tools can automate this process by sending a personalized text request the moment a job is marked "complete." If your conversion rate is low, you need to iterate on your "ask"—perhaps by explaining to the customer exactly how much a review helps your small business while you are finishing the job.
The Ultimate Goal: Pivot or Persevere
Once you have three to six months of data on your dashboard, you must look at your metrics and be brutally honest with yourself:
Conclusion: Trust the Data, Not Your Gut
Measuring your business can feel like a chore when you are exhausted after a long day in the field. It is tempting to believe that if you just work harder and do a "good job," everything will work out. But hard work without data is just a treadmill.
By tracking your Customer Acquisition Cost, using a disciplined Cost-Plus pricing model, and leveraging FSM software to monitor your "Review Engine," you are transforming from a person with a toolkit into a true business executive. These numbers provide the confidence you need to take risks—like raising your prices or expanding your service area—because you are basing those risks on evidence, not emotion.
In our final post of this series, we will move to the "Learn" phase. We will discuss how to interpret this data to build a long-term strategy that allows you to step away from the daily tools and move into a leadership role. For today, your task is simple: look at your last five jobs and calculate your true profit margin. The truth is in the numbers.
Would you like me to create a simple spreadsheet template or a checklist you can use to track these metrics during your first 90 days?


No comments yet
Be the first to share your thoughts on this article!